Rowing Stroke Metrics
We have carefully evaluated a range of different metrics and have selected the ones we found the most useful and expressive in daily training. All metrics share the common goal of capturing a property of the acceleration graph in a simple to interpret number. We hope this helps coaches compare different stroke characteristics on a more objective basis.
All metrics are calculated based on the average of the last 5 stroke to make them more stable. This also means they are updated only every 5 strokes. The red line you see is the averaged acceleration graph, whereas the green line is the relative speed over time. What does relative mean in this context? It’s not an absolute speed, but a speed measured relative to a reference speed. The reference point in our case is the catch at the very left of the stroke graph. The relative change in speed is highly imporant in rowing. The result of applying acceleration to our boat is a change in speed. Effective rowing technique aims to achieve a high average speed over the course of a stroke. Tthat’s why the structure of the speed curve is highly important.
Stroke Efficiency
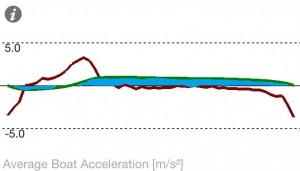
Stroke efficiency tries to estimate how efficent a crews distribution of power is over the stroke. The basic idea is that the boat has a higher average speed if the crew maintains a high boat speed for a longer part of the stroke. You can refer to the improve your stroke post for a bit more background on this. Stroke efficiency is calculated as the area under the speed graph, marked in blue below.
We need to be careful interpreting that number as a distance however, since we’re not measuring absolute speed but relative speed. So stroke efficiency is the distance covered each stroke due to the deviation of boat speed from the speed at the catch. For an intuitive explanation, please see “Stroke Efficiency Explained“. Good rowers achieve a stroke efficiency between 2.5 and 3.5 in the single sculls. What affects stroke efficiency? The two most important factors are the catch and recovery phase. Remember that the boat is slowest while catching, so it’s important to bring the boat back up to speed as fast as possible. After the drive phase, we enter the recovery phase with maximum velocity. Because the recovery phase is quite long, it’s important to maintain this velocity for as long as possible. In the above example, we see deceleration (red) very early in the recovery phase, corresponding with a decline in boat velocity (green).
Catch Duration
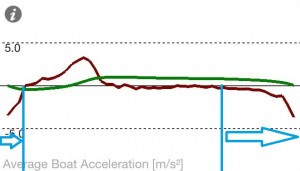
Catch duration measures the time your boat is decelerating at the catch.
Catch duration is measured in seconds and lower numbers are usually better. Crews with a good recovery phase achieve catch durations in the range of 0.35s. Remember though, that the catch is not only about how long you deccelerated your boat, but also about the intensity. How well a crew manages this trade-off can be seen in stroke efficiency.
Catch Efficiency
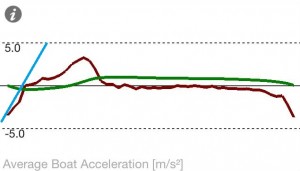
After the blades hit the water, it’s important how fast you can start accelerating your boat again. Catch efficiency is the slope between the point of maximum negative acceleration and the point where zero acceleration was first hit. This is illustrated in the figure below. Catch efficiency is the slope of the blue line.
A higher catch efficiency is advantageous because it indicates at a quick increase of boat speed at the catch.
Check Factor
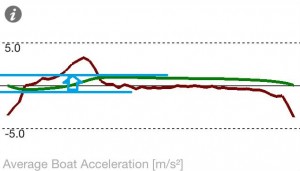
The check factor is simply the difference between maximum and minimum boat velocity.
A lower check factor indicates a smoother movement of the boat, which is advantageous because it minimizes the loss of energy of the rower-boat system due to friction. The problem with friction or more precisely drag is that it increases non-linear with boat speed (in fact, the power to required to overcome drag is proportional to the cube-root of velocity!). This means that at the same average boat speed over the stroke, differently shaped speed graphs can result in a very different total energy expenditure.


Why not use a *rolling* 5-stroke average?
I agree…On *each* stroke, take the average of the last 5 (or 3 or whatever) most recent strokes. Getting the stroke metrics every five strokes is pretty slow. It would be much better to get updates of the metrics on every stroke.
Before advocating any form of ‘digital filtering’ such as rolling averages, you need to understand the characteristics of your filter – i.e what it attenuates (filters out), what it allows to pass, and by how much and at what frequencies – and your choice of filter also needs to be based on what you expect the output to be.
A ‘rolling average’ needs to sample enough points for random ‘noise’ to cancel itself out and, because it gives equal weight to each sampled point, is best suited to a signal you expect to remain constant (apart from the noise).
Your filter could, of course, give different weights to different sample points. One simple example is (x1 + 2 * x2 + x3)/4. This filter is not best suited to things expected to remain constant but is better than a 3-point rolling average for things expect to vary gently.
There are indeed a lot of options to choose from and we’ve done our fair share of modeling and backtesting different filter designs. At the end of the day, filters may reduce “noise” (and there’s all kinds of different noise in signals) but may introduce new artifacts. For any serious analysis of the metrics, I strongly advocate using normalized typical strokes from RiM Analytics: https://docs.rowinginmotion.com/en/analytics-typical-stroke.html In fact, that’s the whole reason we created it. Once you sample > 30 strokes you will notice that metrics and the typical stroke curves are a fairly stable characteristic of the crew involved.
The idea behind not using a _rolling_ average in the app but instead using a _block_ of 5 strokes is that it allows you to play with technique in a meaningful manner on the water (i.e. row 5 strokes this way, then focus on a specific technique improvement for the next 5 strokes, observe and repeat). Of course you could also do the same with an equal-weighted (or rolling) average and just close your eyes for 5 strokes before looking at the RiM App again, but we found this encourages athletes to spend too much time looking at a display instead of focusing on their technique. For proper analysis, use RiM Analytics and sample > 30 strokes.
I am afraid I do not understand some of the discussion. First, under stroke efficiency it is stated that the boat is slowest at the catch. This is not true. The best rowers will pull their body to the stern during the recovery and placing the blade (catch) so that the boat speed will be at its greatest at or just before the catch, not at the end of the drive. The drive moves the rowers body out of the stern and into the bow, causing momentum transfer. The boat will slow because the center of gravity of the rower/boat combination slows as the rower’s body moves toward the bow. Eventually, the combined drive force accelerates the rower/boat combination until it recovers its pre-catch velocity, this occurring around 15% of the drive length. The boat then accelerates during the drive and then maintains or increases its speed during the recovery as the rower pulls their body out of bow and into the stern.
“Check” commonly occurs if the rower places foot pressure on the foot stretcher during the recovery, which slows the boat. Dr. Kleshnev has shown that elite level boats have a shorter but deeper negative acceleration phase. The area under the negative acceleration curve is less than if the rower uses foot pressure to slow down into the catch, since that makes the period of negative acceleration longer. This makes the ratio not as meaningful as it would be under normal circumstances because I am interested in minimizing the area of negative acceleration, not specifically minimizing the ratio.
I think that “catch duration” is the time from the blade being squared up to it being buried deeply enough to be able to apply drive force. A rower may wish to completely bury the blade before applying drive force, or may ramp up the drive force as the blade is buried. In neither case can I see it taking as much as .35 second. As noted above, the rower should not be applying pressure on the foot stretcher until the oar is buried enough to sustain that pressure efficiently. However, this time may be longer if the rower squares up before starting to place the blade, and this may be what the article is meaning as catch time.
Re boat speed: The point where the boat is slowest is indeed not before the maximum catch angle but shortly thereafter. When we look at the acceleration graph it is at the point where acceleration just returns to 0 from the negative peak at the catch. Usually this is about 5° into the drive and where I consider the catch complete. Sorry if this was confusing, I will consider revising the article.
Where the boat speed is fastest during the stroke depends on the recovery, not all rowers accelerate the boat by pulling it underneath them during the recovery at low ratings, though it seems to universally happen above 28spm. Note that it would be optimal to keep boat speed nearly constant to minimize the effects of fluid drag.
I can second Dr. Kleshnevs observation re. elite athletes having shorter catch durations but with higher magnitude negative acceleration. At constant average stroke speed, the area under the graph of negative acceleration and positive acceleration are equal, but what’s indeed interesting is the variation of boat speed (i.e. you can achieve the same average speed with a larger or smaller variation). Our check-factor metric captures this.
Note that our catch duration metric definition differs from yours so you can’t compare it with what you describe. I agree that the metric you describe would be useful but it requires force angle and time data from the oars which we don’t have available when just using a smartphone. And there’s a ton of other interesting metrics you can compute once you have that kind of data. However the advantage of the catch duration as we define it (duration of the negative acceleration phase) is that we found it to be empirically well correlated with good rowing technique.