View your Rowing Courses on Analytics
We have just pushed a new update to Rowing in Motion Analytics that lets you view your exercise information on a map. Right now, we simply plot your course on top of a map but we have plans to add some exciting new features that will allow you to correlate track and other information. This will make it easier to select the correct portions from logfiles for further analysis.
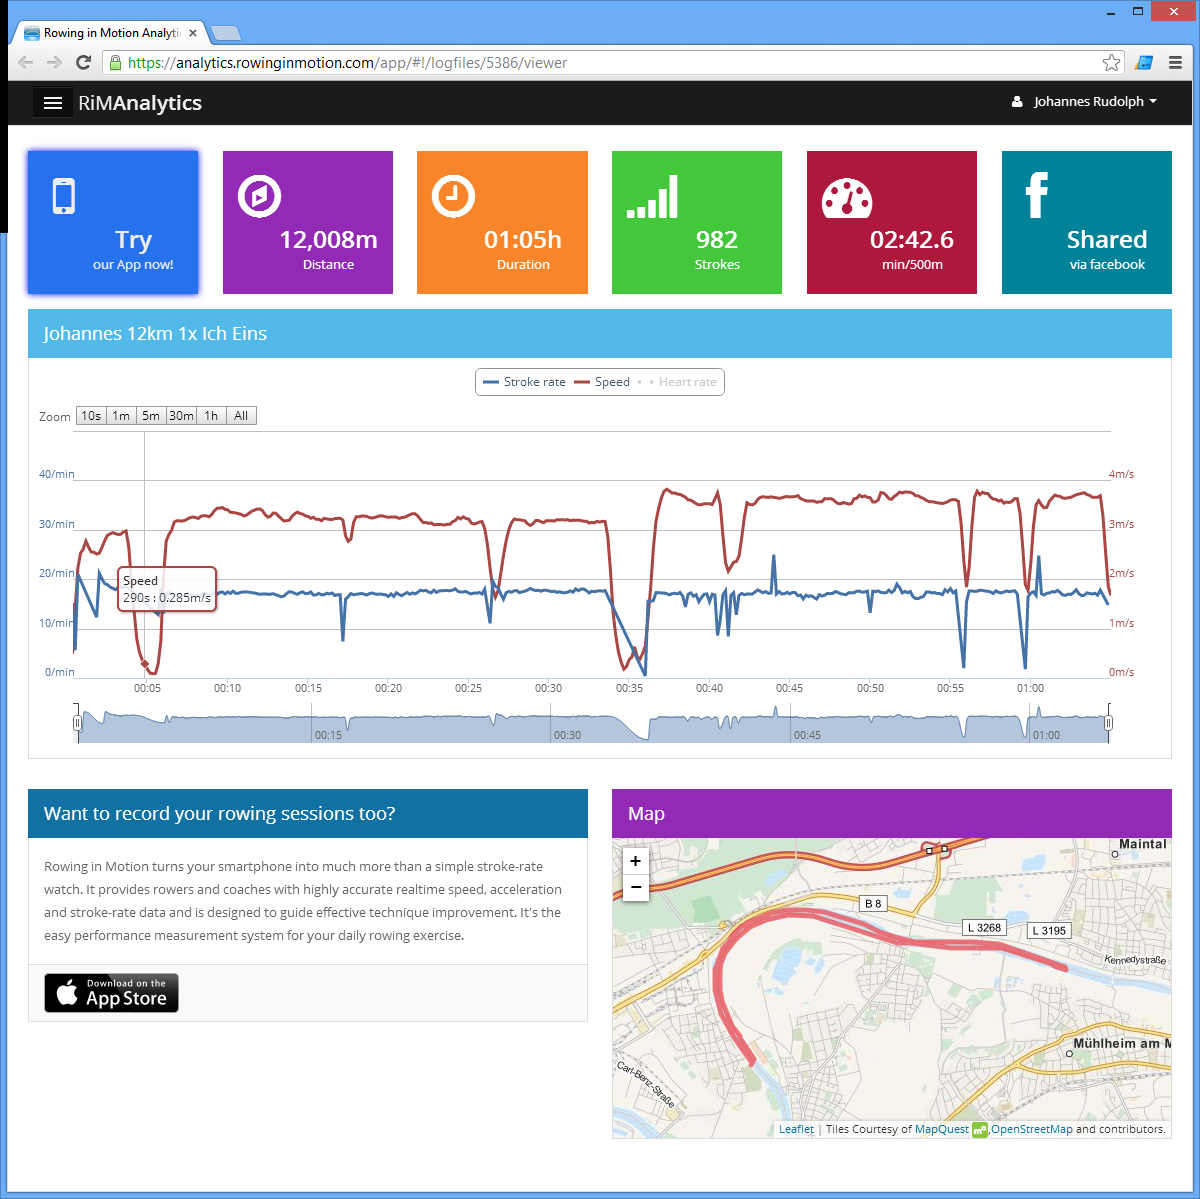
The maps are prominently placed next to the logfile outline graph. The layout is adapted in such a way that we can fit the map and outline data easily on an iPad sized screen next to each other. The current layout is pretty good, but we have some ideas to make it adjustable so it fits better on other screens as well.

Our maps are powered by the OpenStreetmap database and the user-interface uses hardware acceleration for display, to provide a great experience on mobile devices.
Oh, and we replaced the “Maps coming soon” widget on the public logfile viewer too, of course.