Typical Stroke Analysis with Normalization
One common problem with comparing the acceleration profiles of typical strokes is that slight variations in stroke-rate make it hard to reliably assess the real difference between two or more examined profiles. We deployed an improvement to Analytics that allows you to make such comparisons more easily.
Comparing profiles at different stroke-rates
As an example, let me show you my acceleration profile in the single 3 months apart. Apart from being totally horrible at the catch, would you guess there’s some change in my typical acceleration profile in those three months?
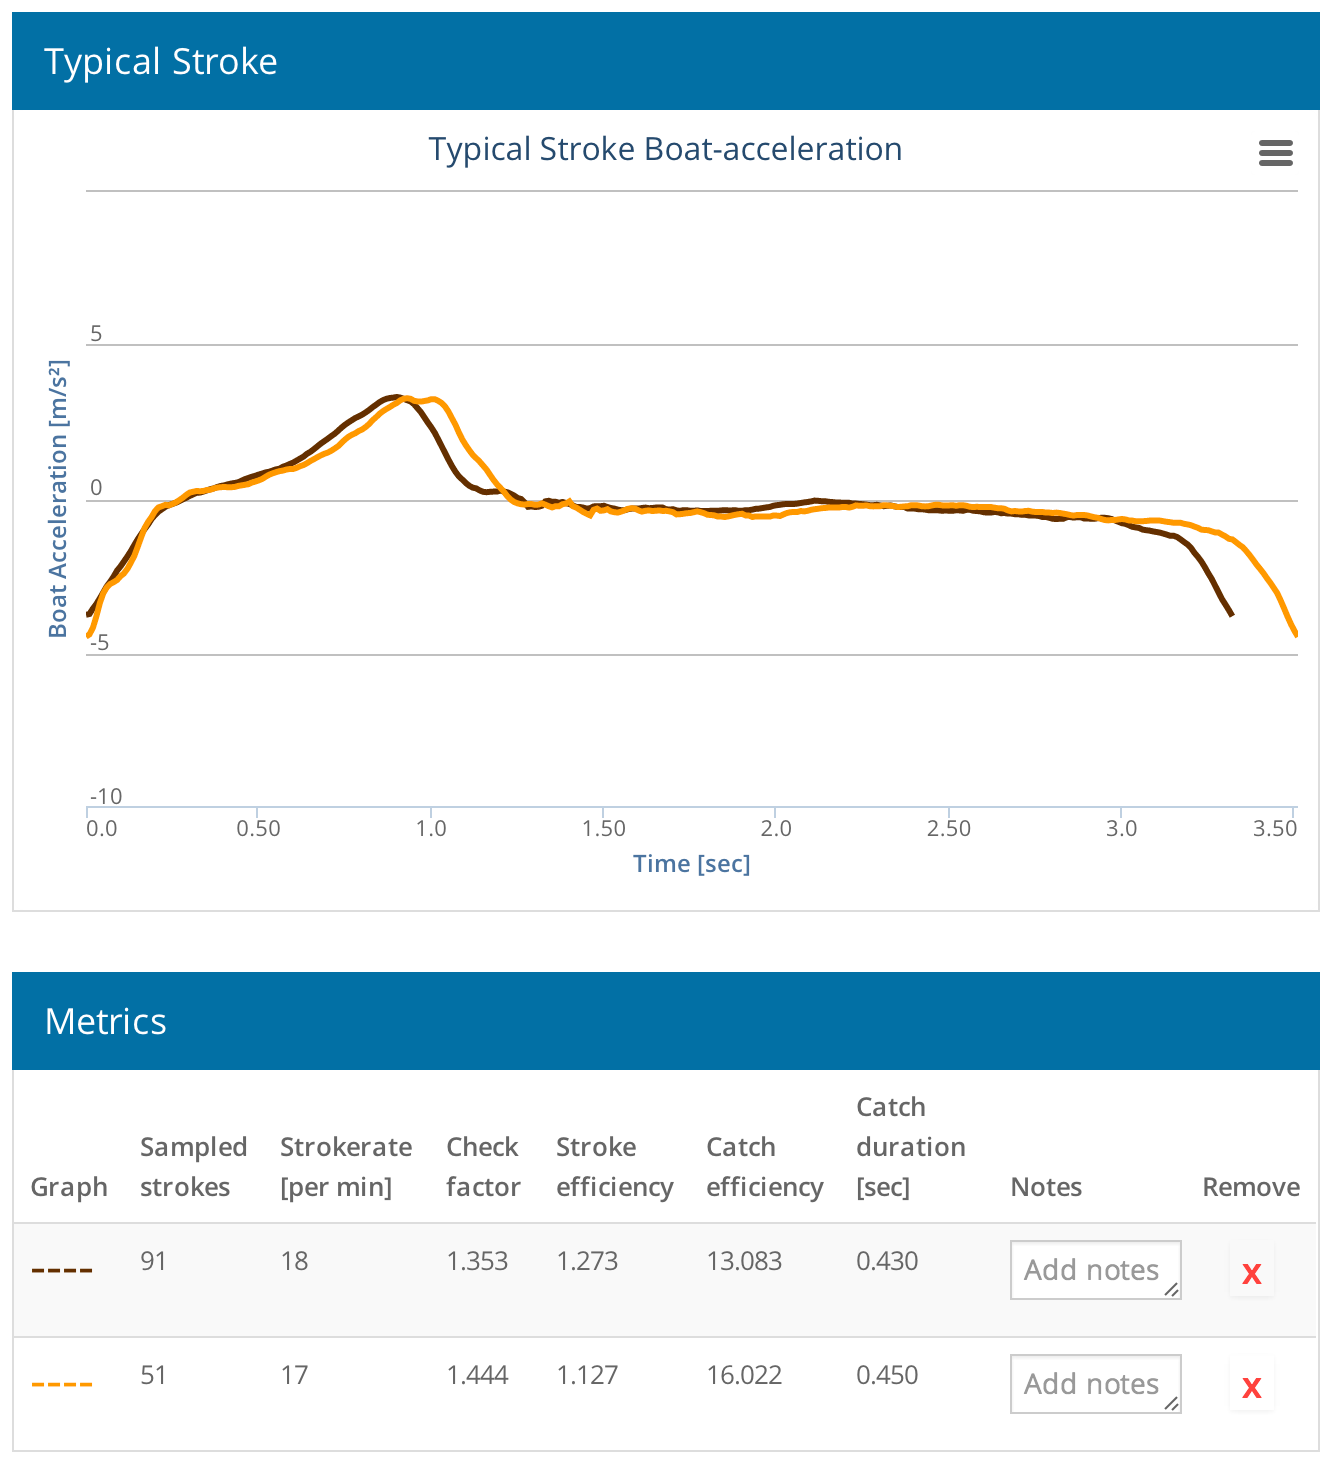
These two profiles have been sampled at stroke-rate of 17 and 19 from 91 and 51 strokes each, so they are a really consistent representation of my typical stroke. You might think there’s a difference between these patterns, but if we compare two profiles from the same rowing sessions at exactly the same stroke-rate you can clearly see there’s almost none.
In order to allow coaches and athletes to make better judgements about the changes in typical stroke acceleration profiles, you need to be able to easily ensure analysis can be created at the same stroke-rate.
Normalizing Typical Strokes
This is where normalization of typical stroke profiles comes in. Let me give you a brief overview of how typical stroke profiles are calculated and then demonstrate how a recent change we deployed to this algorithm resolves this issue.
Calculation of typical stroke profiles basically works like this:
- Split the recorded acceleration values into individual strokes
- Determine the average stroke-rate and re-sample all strokes to that length (normalization)
- Determine the average acceleration at each sample point to build the typical stroke profile
The second step is what causes us headaches in analysis, because it means that typical stroke profiles will be calculated to “in-between” stroke-rates (e.g. 17.05). This “in-betweenness” however is what makes it so difficult to compare profiles, because they will likely be profiles of slightly different stroke-rates.
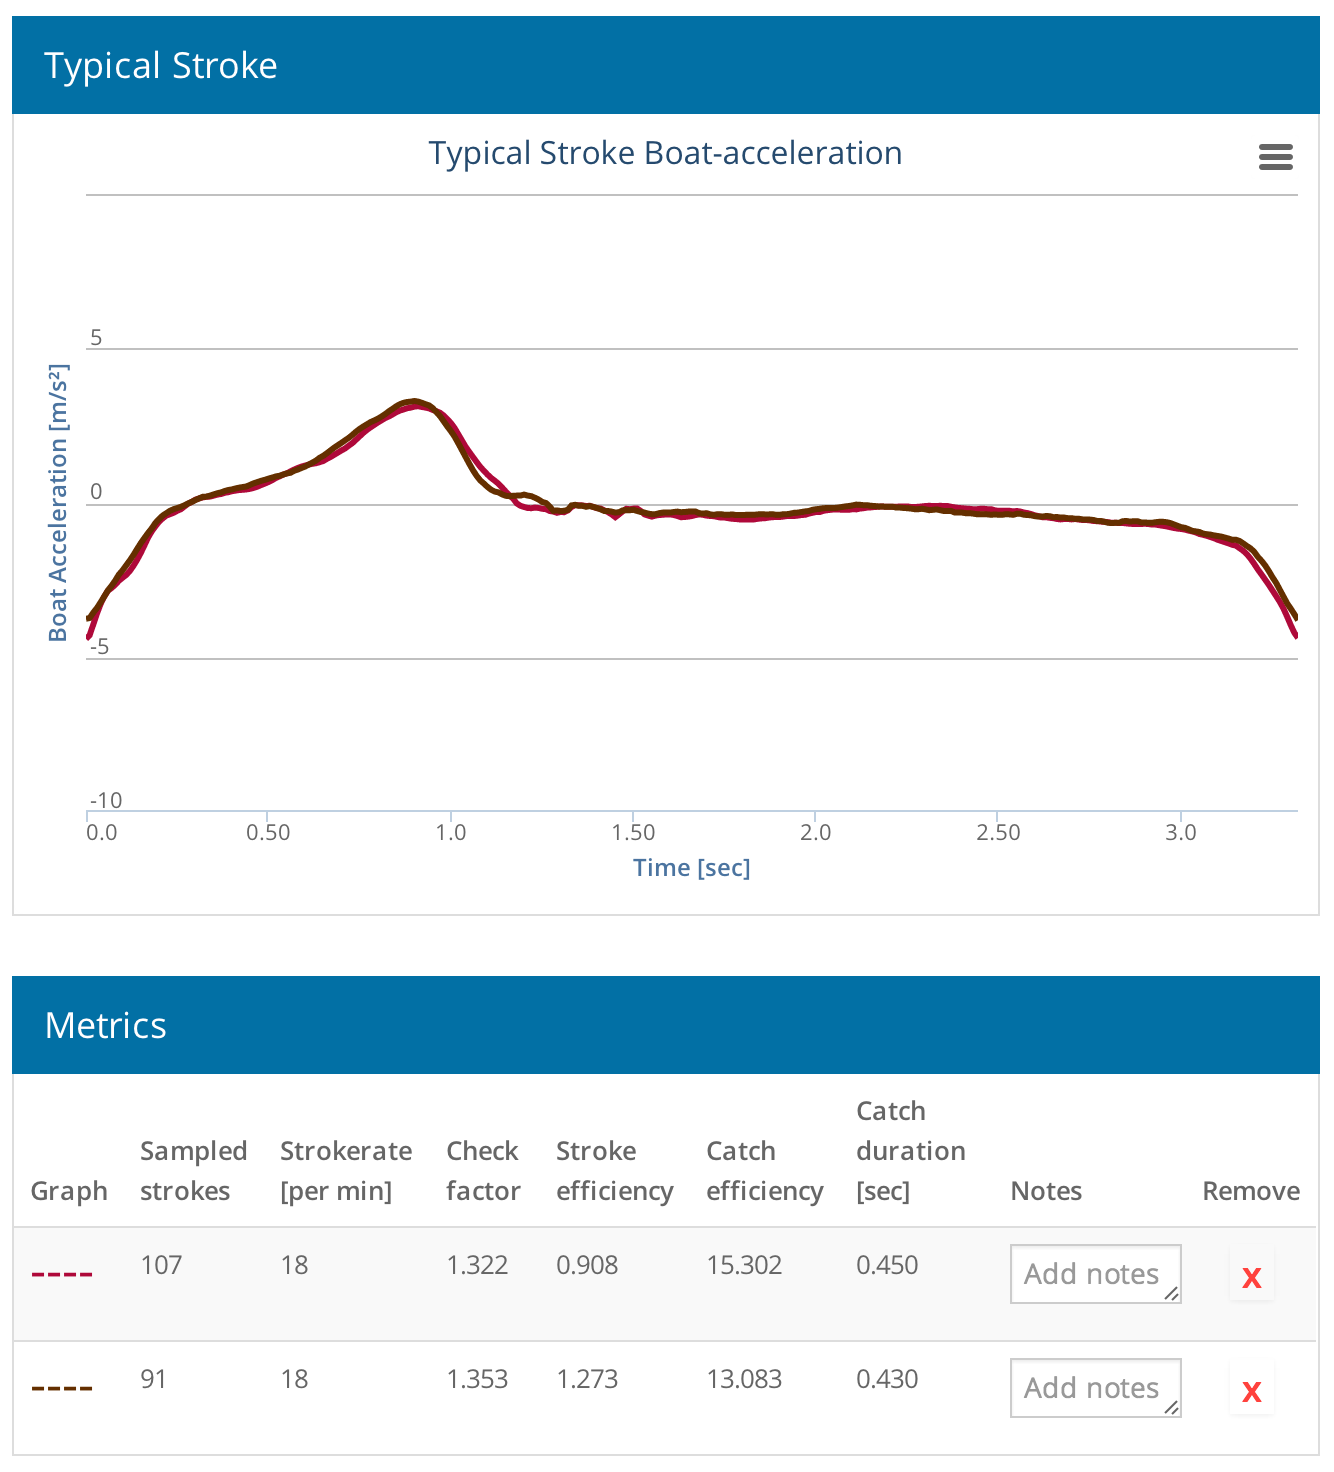
To ensure profiles are calculated for well-defined stroke-rates, typical stroke profiles will now be calculated for whole stroke-rates only (eg. 17.0, 18.0 etc.). Additionally, the algorithm discards strokes from the calculation that are outside of the +/- 1 range around the target stroke-rate. You can review the number of strokes that were sampled to calculate a typical stroke profile in the table with the metrics. Generally speaking, the more strokes sampled the more representative this typical stroke profile is.
Brilliant!!