Testing Boats and Material with Rowing in Motion
One of the most interesting things you can do with Rowing in Motion is to test different boats, material or rigging with your crew and find the combination that makes the crew go fastest. With realtime feedback and easy post-exercise analytics, Rowing in Motion can help you get objective data to make your decision. Some of our customers have already used Rowing in Motion to decide which type of blades to use with their crew but there’s a host of other things you can test as well. Here’s a few tips that we’ve learned while performing such tests ourselves.
Establish a test protocol
Yes, no-one likes to do protocols but for reliably testing crew, material or rigging combinations it is super critical you record
- what configuration is being tested (crew, boat, material, rigging)
- what the conditions were on the water (wind direction, wind speed, wash)
It’s obvious that you can only compare data recorded in equal conditions, so make sure you have them stable before testing. It’s best if you can test things in a quick succession because that ensures that the crew has about the same level of fitness and conditions are more likely to be consistent.
Establish a test profile
If you plan to optimize your 2000m performance, you should test under realistic race conditions. Most prominently, that means you will need to row at race frequency. Nonetheless, it’s useful to test at one or two lower frequencies too. Why is that? If the difference between two configurations are significant, you will likely see the same differences in acceleration patterns no matter what the stroke rate. By testing at different rates, you are able to tell whether a change is significant or not. We prefer to row a fixed profile that allows the boat get up to speed at different speeds and have the crew accomodate. We think the below profile is not really exhausting for well-trained athletes at can be easily repeated 2-3 times in a row to test different configurations.
- 20 stokes at SF 20
- 20 strokes at SF 24
- 20 strokes at SF 32
- 20 strokes at your race frequency
Analyze using Rowing in Motion Analytics
Right now Rowing in Motion Analytics allows you to compare typical stroke profiles in a single logfile only. We plan to fix that in the future, but for now it’s best if you can make changes directly at the dock and record all tested configurations in a single logfile. When selecting the data ranges to calculate the typical stroke from, we recommend you do not select the first 5 strokes of each step in the profile. During these five strokes the boat velocity is changed between strokes to get the boat up to speed and these strokes typically show a high deviation from the typical stroke, that would skew the results a little.
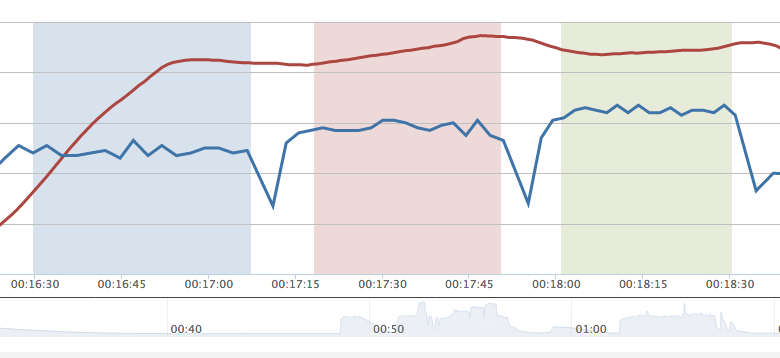
To select the data ranges in analytics, you should zoom into the graph to allow making a more precise selection. You should then select the last 15 of the 20 strokes at each stroke rate. Here’s an example
Tips for data interpretation
You should check out some of the theory behind boat acceleration and how it changes during the rowing stroke. Have a look at Optimize your Rowing Stroke with Rowing in Motion and the Analysis category on our blog where we post some of our thoughts and analysis results. In general you should not compare apples to oranges and only compare data at the same stroke rates. To be fair, interpreting this data is not easy and takes a bit of experience. If you need any help, please don’t hesitate to write to us and we’re glad to help you interpret your data.
Now it’s your turn. Tell us what you have found helps your crew go faster in the comments. We’re keen to hear about your story.
I’ve written a blog post on my clubs own testing using the process you described above, and how we analysed the outcome and made a decision on how to move forward. As I have a science background it’s great to finally be able to apply some vaguely scientific theory to trying out new things in rowing!
http://rowingmusings.wordpress.com/2013/05/17/using-telemetry-to-select-the-best-rowing-equipment-for-you/