Rowing in Motion 4.4
Today we are releasing version 4.4 of the Rowing in Motion for Teams and Solo App. As usual, the update is available immediately for Android Users and will be available for iOS users after Apple has completed their mandatory review procedure.
New Drag Efficiency Metric
The most efficient way to move a boat through the water is at a constant speed. When the velocity of the boat varies throughout the stroke, energy is wasted overcoming the disproportionally higher drag encountered in those parts of the stroke when the boat moves faster than the average speed.
Drag efficiency captures this accurately by calculating the power required to move the shell at a constant speed of 5m/s (which is equivalent to a 6:40min on a 2000m race) and the power required to move the shell at an average speed of 5m/s with the velocity variations of your current typical stroke.
A drag efficiency of 90% would thous imply that 90% of your power is used to overcome the inevitable drag whereas the remaining 10% of power applied are wasted on additional drag resulting from velocity variations. If you were able to improve drag efficiency by 1%, you can save roughly 1.4s on a 2000m race while maintaining the same rowing power.
How can we calculate this number without knowing the actual power in terms of watts that the crew puts into the system or knowing the specific drag factor of the boat being used? Put simply, the mathematic model behind this metric is formed in such a way that all these factors cancel out. By projecting velocity variations to the same average speed of 5.0m/s this metric is comparable between crews and differing environment conditions while at the same time allowing an intuitive interpretation (seconds saved over 2000m race).
Drag Efficiency is available in the Apps for athletes and their coaches as well as in Analytics on all typical strokes (including saved typical strokes).
Renamed Metrics
In light of these changes, it’s been about time we fix some of the naming of metrics to be more consistent across the board. We tried to use terms that are relatively well defined in the biomechanic literature when possible and wherever terms are inconsistently used in the literature (like check factor) we tried to pick our own name that better captures our own interpretation of the metric.
| New Name | Old Name | Description |
|---|---|---|
| Catch Duration | Catch Duration | Length of significant decelleration phase (acceleration < -1.0m/s²) |
| Check Delta | Check Factor | Difference between minimum and maximum speed of the shell in m/s |
| Stroke Characteristic | Stroke Efficiency | The distance covered each stroke due to the deviation of boat speed from the speed at the catch |
| Catch Slope | Catch Efficiency | Slope of the acceleration curve at the catch in m/s³ |
| Drag Efficiency | new | Ratio of energy necessary to overcome drag with constant speed vs. the actual variation in speed |
| Drag Inefficiency | new | Percent of total energy wasted to overcome drag due to variation in speed (= 1 – DragEfficiency) |
Improvements to the Apps
Here’s the summary of changes:
- New metric: Drag Efficiency and Drag Inefficiency
- New speed units: Speed is now available in more units m/s, pace/500m, pace/1000m and km/h
- Fixed sonification sometimes not producing a sound when enabled
- The App now responds more quickly with an alert when a live-telemetry connection has failed
- Android: Fix rare BTLE issues on some Samsung Galaxy Devices (including the S3)
Improvements to Analytics
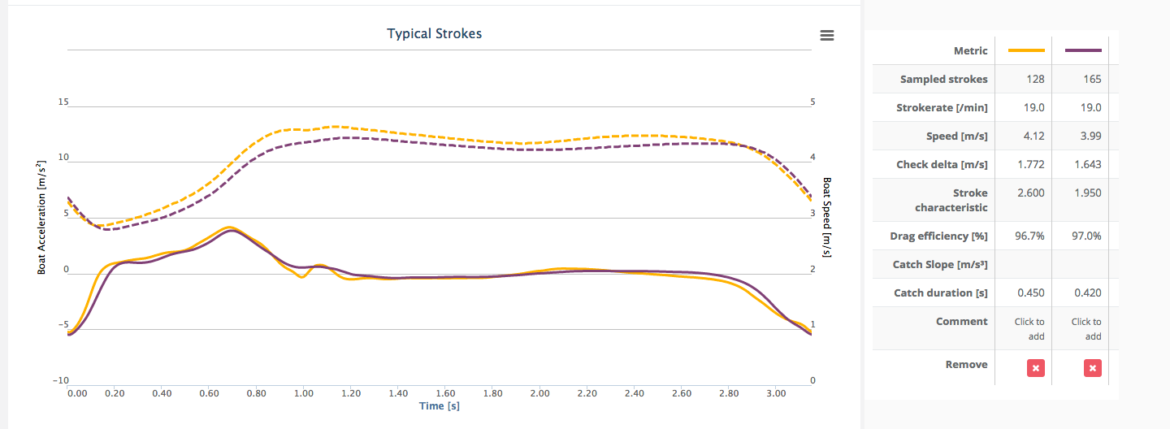
The new Drag Efficiency Metric is now displayed in the typical stroke metrics table. The rename of metrics has been applied to analytics as well.

I am constantly amazed at the continual development and implementation of new and useful tools!! Thank you for your passion and sharing of knowledge. Making such metrics available to the everyday rower as well as top international teams can only move the sport forward at warp speed (depending on the catch efficiency of course..)