Rowing in Motion 1.4 released
As of Monday, Rowing in Motion v.1.4 is available on the App Store. This post will explain some of the new features.
Heart Rate Monitoring:
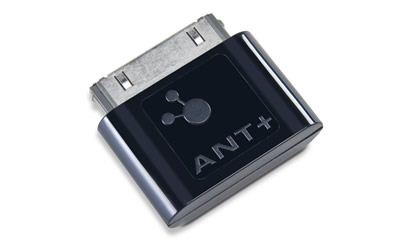 The Boat App now supports the Wahoo Ant+ Key. Just plug the key into your iPhone and wear a compatible ANT+ Heart Rate Strap. All configuration is handled automatically. We have found the wireless transmission has a good range of about 5 meters, which should be more than enough even for a crew boat. Right now, we only support connecting a single heart rate sensor at a time, although the key is capable of handling multiple sensors. Let us know if you have a use case for that. Hear rate data is logged in v.1.4 log files and will be available for data analysis. Heart rate data is of course live-transmitted to the Coach App and can be reviewed live on the water.
Stroke Metrics
The biggest improvement in version 1.4. are the new stroke metrics. We have carefully evaluated a range of different metrics and have selected the ones we found the most useful and expressive in daily training. All metrics share the common goal of capturing a property of the acceleration graph in a simple to interpret number. We hope this helps coaches compare different stroke characteristics on a more objective basis.
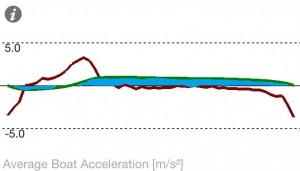
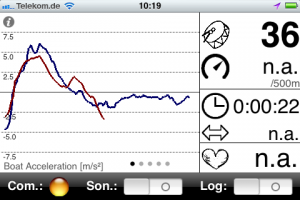
All metrics are calculated based on the average of the last 5 stroke to make them more stable. This also means they are updated only every 5 strokes. The red line you see is the averaged acceleration graph, whereas the green line is the relative speed over time. What does relative mean in this context? It’s not an absolute speed, but a speed measured relative to a reference speed. The reference point in our case is the catch at the very left of the stroke graph. The relative change in speed is highly imporant in rowing. The result of applying acceleration to our boat is a change in speed. Effective rowing technique aims to achieve a high average speed over the course of a stroke. Tthat’s why the structure of the speed curve is highly important.
Stroke Efficiency
Stroke efficiency integrates under the speed curve yielding a distance. This can be seen in the below illustration as the blue area.
We need to be careful interpreting that number as a distance however, since we’re not measuring absolute speed but relative speed. A simple rule is that higher numbers indicate more efficient technique. Good rowers achieve a stroke efficiency between 2.5 and 3.5 in the single sculls. What affects stroke efficiency? The two most important factors are the catch and recovery phase. Remember that the boat is slowest while catching, so it’s important to bring the boat back up to speed as fast as possible. After the drive phase, we enter the recovery phase with maximum velocity. Because the recovery phase is quite long, it’s important to maintain this velocity for as long as possible. In the above example, we see deceleration (red) very early in the recovery phase, corresponding with a decline in boat velocity (green).
Catch Duration
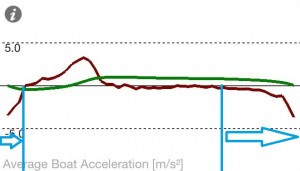
Catch duration measures the time your boat is decelerating at the catch.
Catch duration is measured in seconds and lower numbers are usually better. Crews with a good recovery phase achieve catch durations well below a second. Remember though, that the catch is not only about how long you deccelerated your boat, but also about the intensity. How well a crew manages this tradeoff can be seen in stroke efficiency.
Catch Efficiency
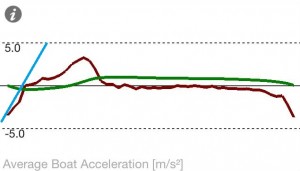
After the blades hit the water, it’s important how fast you can start accelerating your boat again. Catch eficiency is the slope between the point of maximum negative acceleration and the point where zero acceleration was first hit. This is illustrade in the figure below. Catch efficiency is the slope of the blue line.
Check Factor
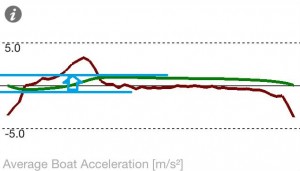
The check factor is simply the difference between maximum and minimum boat velocity.
A lower check factor indicates a smoother movement of the boat. In our experience, check factor has the least correllation with stroke efficency. A big advantage of the check factor is it’s robustness. And its very easy to understand too.
Metric Views
Having metrics is nice, but visualizing them in a way athletes and coaches can easily recept and work with them is a though challenge. We’re pretty sure that we haven’t found the best solution yet, so if you have an idea about visualizing (or sonifying) metrics please let us know! The iPhone naturally has a very limited amount of space available, so we provide a set of adapted views for the iPhone and larger views that take advantage of the available screen size on the iPad.
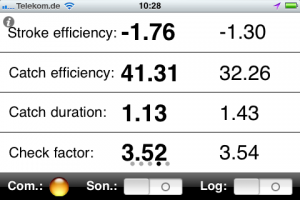
The metrics view on the iPhone shows the metrics for the last 5 strokes and the ones before.
The metrics view on the iPad shows the graph as well as metrics for the past 3×5 strokes.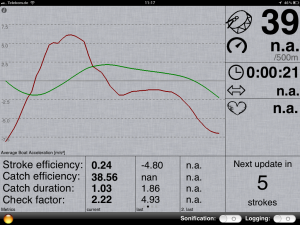
Timer
Version 1.4. brings along a simple timer feature. The timer resets whenever a new log is recorded or the app is restarted. The timer is synced with the Coach App, so coaches know easily how long their crews have been exercising.

