Optimize Your Rowing Stroke with Rowing in Motion
How Rowing Boats move through the Water
Rowing Boats do not move at constant velocity. Velocity is constantly changing over the course of a stroke in a rhythmic pattern. The change in velocity is called acceleration.
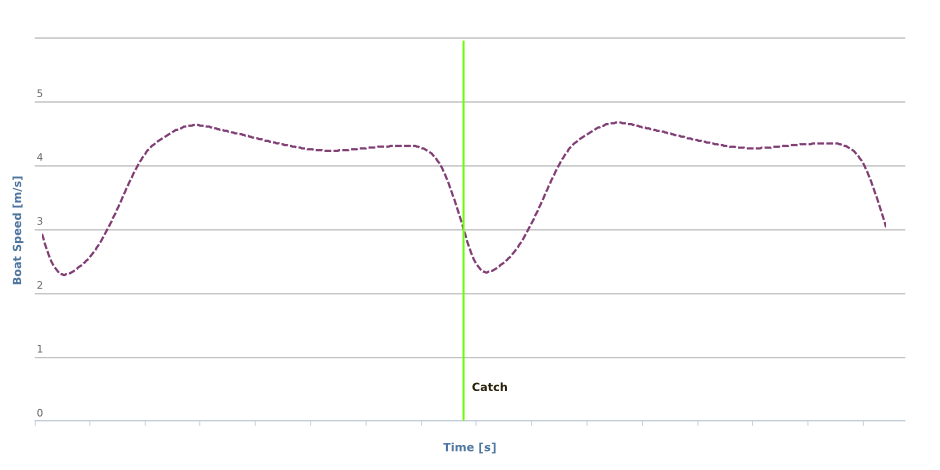
Variation of boat speed for two stroke cycles at 20spm.
In that variation lays the answer to rowing efficiently and increasing the average speed at which the boat moves towards the finish line. The average speed for one stroke-cycle follows a simple rule: any variation in velocity increases the work necessary to overcome fluid drag in the water. Minimize these fluctuations and you will be able to move the shell faster with the same energy expenditure. This is, in essence, our optimisation goal in rowing.
Understanding Boat Acceleration
Acceleration is defined as instantaneous change in velocity of an object. The object of observation in this case is the rowing boat, because that’s what we need to move across the finish line, right 🙂 Velocity is typically measured in meters per second (m/s). Since acceleration is the instantaneous change in velocity, it’s simply the differential of velocity. The units follow from that: m/s².
Boat-acceleration is directly proportional to total boat-force.
Another way to think about acceleration is to treat is as total boat-force, the result of all individual forces acting on the boat at any time. Acceleration is directly proportional to this boat-force by Newton’s second law of motion: F = m*a.It’s important to note that F and a are vectors, that is force does not only have magnitude, but also a direction. As a consequence, forces that are directed in opposite directions cancel out.
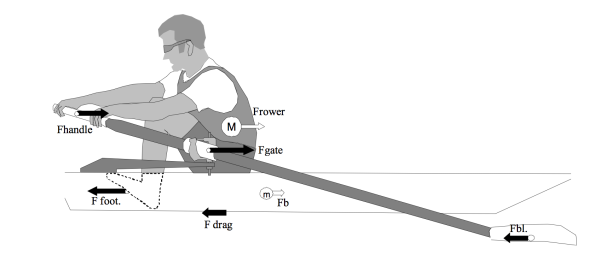
Main forces on a rowing boat. Source V. Kleshnev, Boat acceleration, temporal structure of the stroke cycle, and effectiveness in rowing
For the remainder of this article, I will use a simplified physical model of a rowing boat that will only contain two forces: Those that are directed towards the stern and those that are directed towards the bow. Our boat accelerates when forces towards the bow exceed the forces towards the stern. To better match the view of the athlete, we will simplify this model even further by assuming that these two forces originate from stretcher and handle force only. That reduces the number of variables we need to control during the stroke to two: Handle and stretcher force. Easy, right?
Okay, so forces generate acceleration and acceleration results in a change in velocity. Why is velocity interesting again? Because it determines how fast we move towards the finish line. Let’s for a moment assume that we can measure acceleration with infinite precision over the course of a race. When we integrate under the acceleration graph, we get a velocity graph. If we integrate that again, we have a graph showing us the distance travelled vs. time. And that’s what really matters to us rowers: How fast can we travel a pre-defined distance.
What’s a stroke?
Different forces act in different parts of the stroke and consequently the boat will accelerate and change it’s speed.
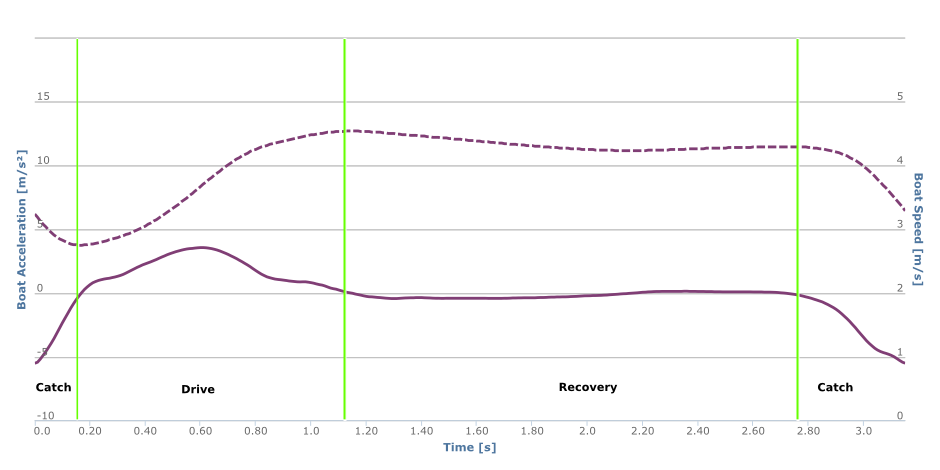
Variation of boat speed and boat acceleration for a stroke cycle at 20spm.
For acceleration analysis in Rowing in Motion, a stroke starts when the blades hit the water at the catch, which coincides with the point of maximum negative acceleration. Until the blades have locked on in the water, the boat continues to decelerate. The boat is slowest, when boat acceleration is zero after the catch. What follows is the drive phase, where the boat is accelerated. The boat is fastest at the finish. During the long recovery phases, there’s typically little change in boat speed. When the crew prepares for the next catch, the boat starts decelerating again.
In Rowing in Motion, strokes are always displayed from catch to catch. We will illustrate the individual phases of the rowing stroke with a Rowing in Motion video in the following, which shows boat acceleration synchronised to a video analysis. A coach can easily record these videos with our App which receives live telemetry from another instance of the App running in the boat.
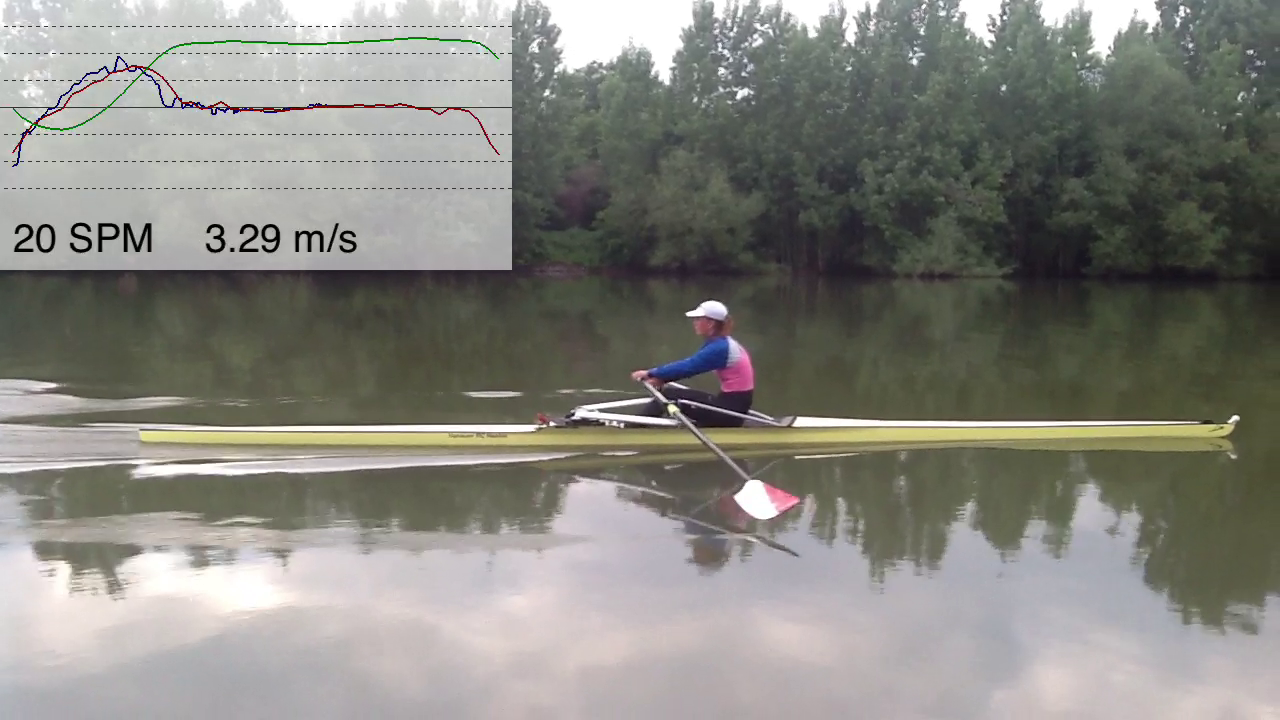
A Rowing in Motion Video shows a video analysis together with synchronized live measurement data.
Let’s look at the graph in the top left corner. The blue line that is drawn above the red one represents the current stroke, whereas the red line is a typical stroke (it’s like an average) that we calculate on the fly based on past strokes. That way, you can instantly see if a change in your rowing technique results in a deviation from that previous typical pattern.
As we can see, the graph is only showing the reference stroke, the current stroke has just begun. The green line is the speed corresponding to the typical stroke boat acceleration (red).
Phases of the Rowing Stroke
We will now go through the different phases of the rowing stroke.
Catch
With the blades squared and about to enter the water, we are about to reach the forward position. Trying to maintain zero acceleration for by slightly pulling on the stretcher for as long as possible is crucial in this phase.
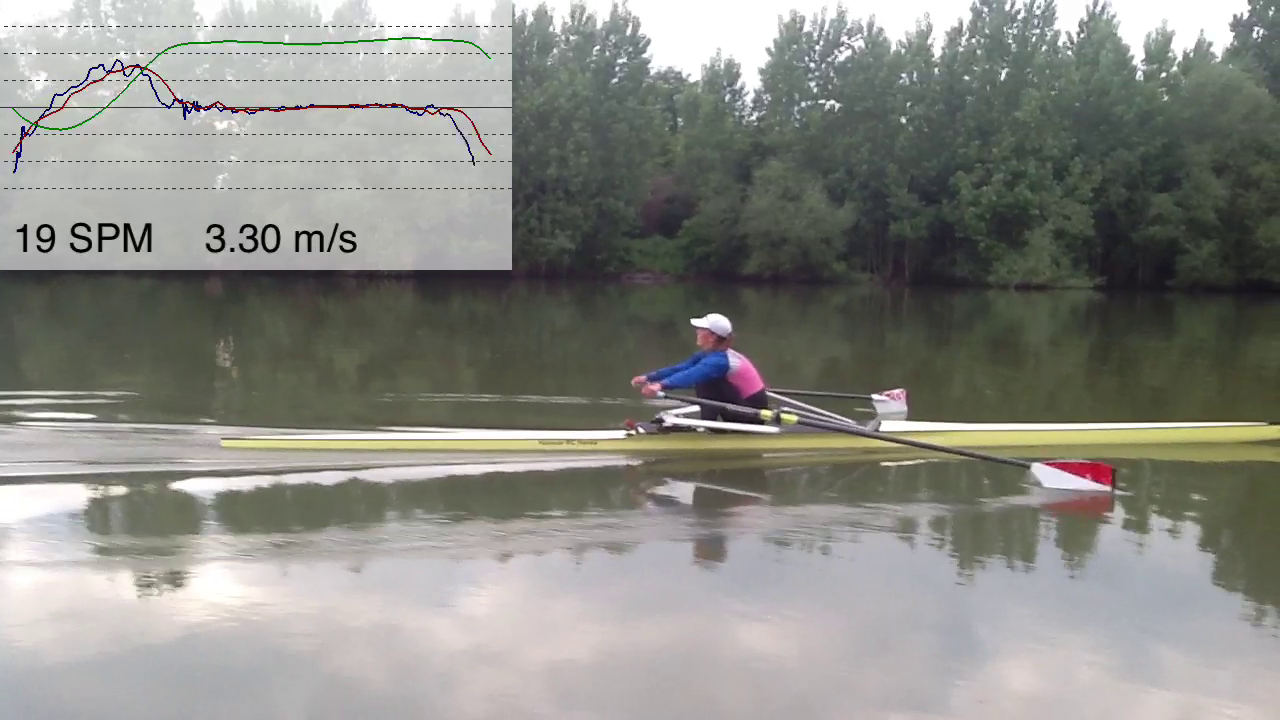
Right before the catch the boat is decelerating because the athlete is pushing on the stretcher.
If you push on the stretcher to early, you will observe acceleration become negative early as well, which means you’re losing boat speed. You need to push on the stretcher at some point, it’s inevitable. But when you do so, we want to have handle force following that as soon as possible to compensate for this negative acceleration. That’s the task of the drive phase.
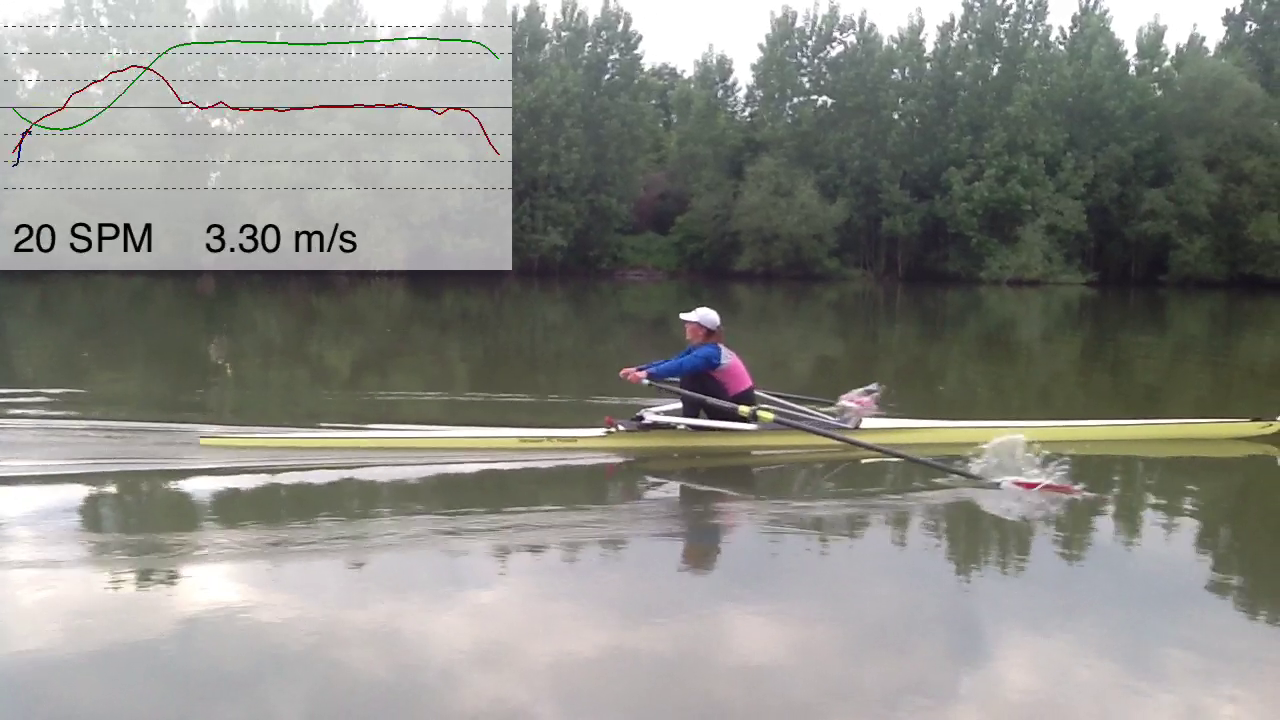
When the blades enter the water and force is applied to the handles, the boat stops decelerating.
Drive
The boat is slowest right after the catch. That’s because we have had negative acceleration all the way into the catch and up until the early part of the leg drive. Until the blades have fully caught on stretcher force is exceeding handle force, resulting in negative acceleration. The point that the acceleration crosses the x-axis, marks the point in time when the boat is slowest. It’s crucial to get beyond that point as fast as possible to achieve a high average velocity over the stroke. When handle force exceeds stretcher force, the boat starts accelerating. Positive acceleration should be maintained during the whole drive phase. The area under the drive phase’s acceleration determines the total gain in velocity and should be maximised. A good coordination between leg, upper body and arms is required to achieve a purposeful acceleration curve.
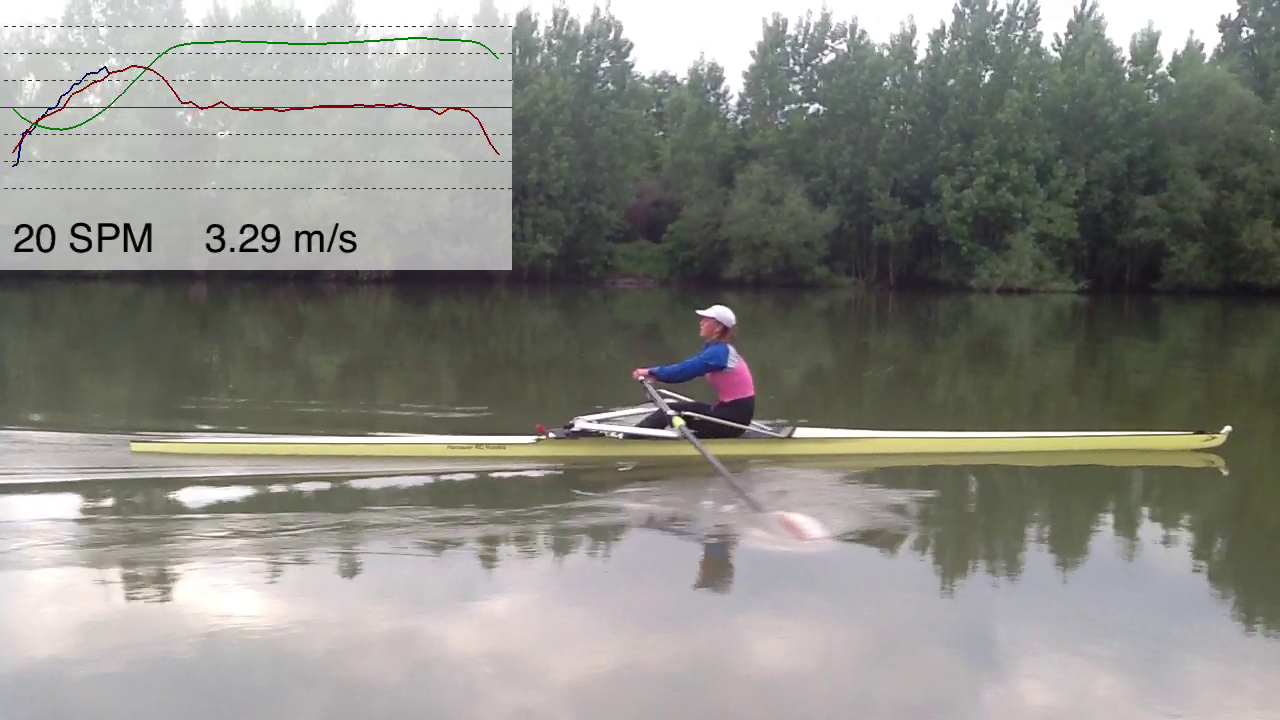
Boat acceleration is positive during the drive phase and boat speed increases.
Extraction
Since the boat has been accelerated for the whole drive phase, the boat is fastest when the blades are extracted. After that, we need to prepare for the next stroke.
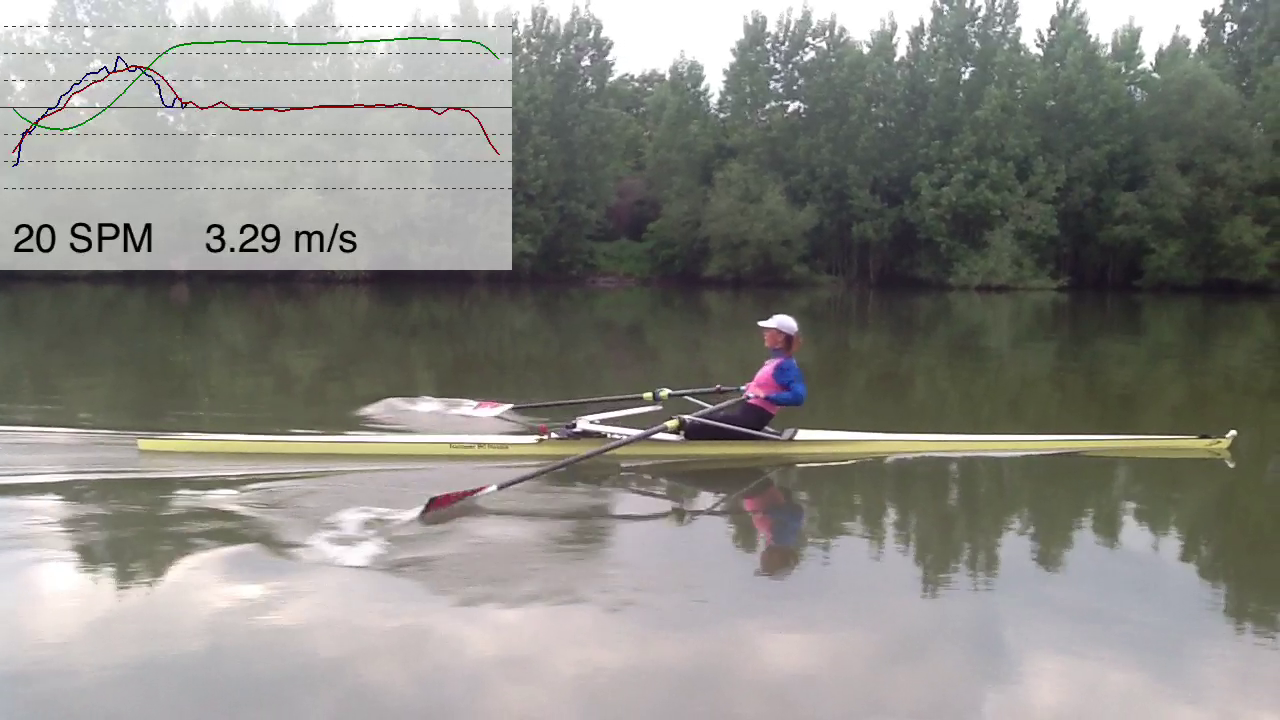
Boat speed is highest at the finish (for low strokerates).
Recovery
It’s crucial to maintain this high boat speed during recovery. Crews should aim at a constant forward motion supported by cautiously exercising a constant pull on the stretcher.

During the recovery boat speed remains constant when drag on the boat is balanced by a gentle pull on the stretcher.
A Video Introduction
The best way to explain how boat acceleration works in rowing is to actually see it synchronized with a real rowing video. So we created a comprehensive introduction video, that shows the different phases of the rowing stroke and how and when boat acceleration occurs. This video introduction helpful to get a first feel for boat acceleration and also discusses the optimisation.
Wrapping up
Rowing in Motion helps you thoroughly analyse and improve each part of the rowing stroke. We have tried not to focus on the specific motion sequences that crews should exercise. Varying opinions exist on these topics, but it’s important to realise that each individual adjustment to rowing technique should be validated for its impact on boat velocity. An easy to use measurement tool like Rowing in Motion helps coaches and athletes make scientifically sound decisions to achieve their goals.
Try Rowing in Motion!

What I like best about my RP3 is the static display of a nice “fat middle” force curve. Can the RiM show me something similar, giving me a curve to emulate, or is it limited to real time data that I have to learn to interpret?