Comparing Boat Speed for three common Rowing Mistakes
In the recently released update 3.2.1 we added support for showing the typical speed graph corresponding to a typical stroke’s boat acceleration to Analytics.
In this post, I want to show you 3 common mistakes that rowers make with their rowing technique and how they show up in boat acceleration, which measures the effective total boat force.
If you want to review the basics of analyzing boat acceleration and want to understand the parts of the stroke where the boat is going fast or going slow respectively, please have a look at our boat acceleration and boat speed introduction to the rowing stroke.
Weak Drive
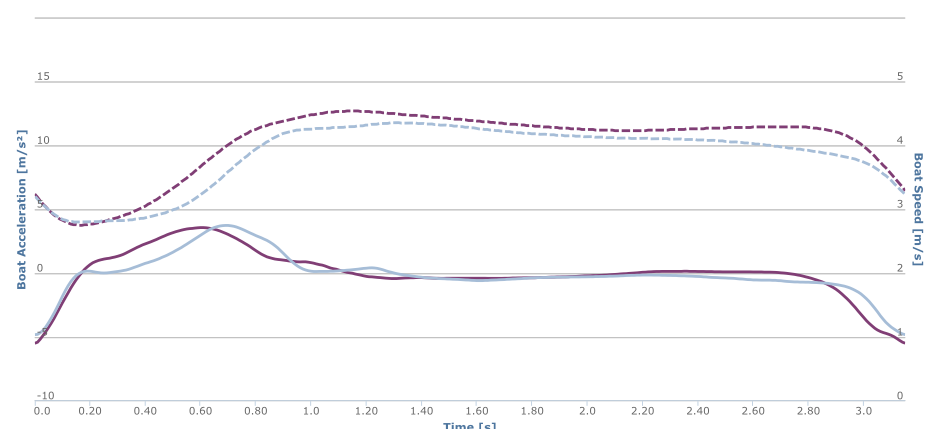
The graphs show boat acceleration at the bottom (solid lines) and boat speed at the top (dashed lines). The addition of boat speed allows a coach to easier see how boat acceleration relates to the actual boat speed. All data that I’m showing here is taken from real measurements and is representative for common mistakes that I have seen rowers make from my own coaching experience as well as from working with athletes and coaches from elite to masters levels.
If we look at the speed graphs, it should be clear that a higher average speed for the stroke (= faster to the finish line) can be deduced by looking at the area between the two graphs. For example in the graph below, the purple speed graph consistently exceeds the blue graph. As a consequence, average boat speed for the purple stroke is higher.
A late force application in the drive results in a lower average boat speed.
In this example, we can see that both athletes achieve a similar peak acceleration of the boat, but the drive of the purple stroke is much more “front loaded” than the drive of the blue stroke. As a consequence, the purple stroke gains more boat speed earlier and can hold on to this speed difference for the remainder of the stroke, which results in a higher average boat speed.
To improve this, athletes should try to focus on an early force application and a good coordination of the legs, trunk and arms and immediately begin the drive. Especially in crew boats, some athletes may have a tendency to “wait” at the catch. This is mostly an issue of not consequently pushing the legs or a too early rising of the upper body hindering an effective force production on the pin. Think about it this way, the upper body needs to transfer the force from the legs via the arms and to the oar handles. The strength of the upper body can thus limit the force at the pin that the legs can effectively generate. Trying not to raise the upper body while driving the blade through with the legs helps keeping the body more rigid and producing more force with the legs.
Standing on the Stretcher
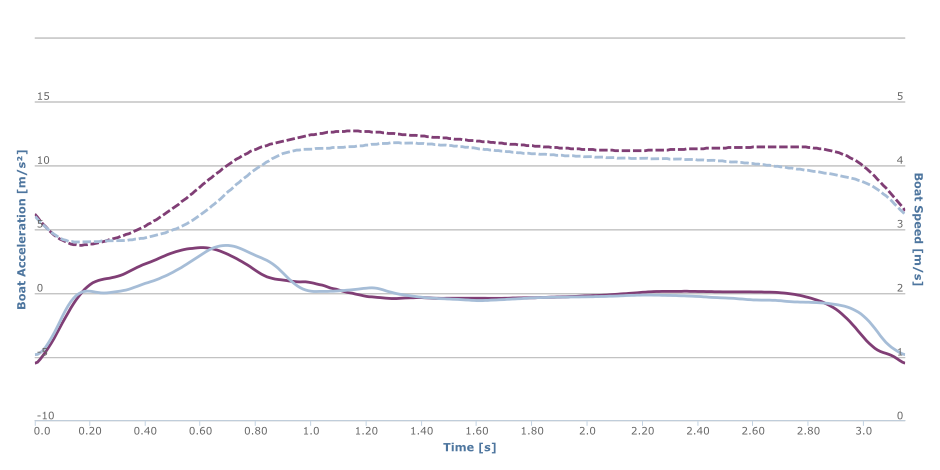
In the same example, we can see another mistake. Looking at the recovery starting at about 2.2s, we can see that the blue stroke’s boat speed steadily falls of. The source for this problem is that the crew is “pushing” on the stretcher, which makes the boat go slower because the force on the stretcher is directed towards the stern. It acts against the direction of travel of the boat.
Standing on the stretcher results in a premature loss of boat speed at the catch.
The purple stroke maintains boat speed for longer, but necessarily has a harder but shorter push on the stretcher. One of our stroke metrics to keep an eye on for this is catch duration, which measures the length of this “pushing on the stretcher” by looking at the duration of the phase with negative boat acceleration.
Where does this early push on the stretcher come from? Coordination on the slide is very important. If we carefully look at 1.2s in the graph, we can see that the blue stroke shows a short boat acceleration here. This is an indicator that the crew pulls on the stretcher to accelerate the sliding seat. A higher speed on the sliding seat means more impulse (the product of a moving object’s speed and its mass) needs to be exchanged with the boat at the catch. For some athletes this is difficult and leads to an earlier push on the stretcher.
Athletes should try to maintain a constant pull on the stretcher for as far into the catch as possible, as this will reduce unnecessary variations in boat velocity and thus increase fluid drag efficiency. Improving the coordination for a quick extension of the legs helps achieving a quick catch. Drop-jumps are a useful exercise for this. Blade-work however is equally important, which brings us to the next common problem.
A weak catch
It is no coincidence that the third mistake we’re looking at happens at the catch as well. The preparation of the catch and executing the catch cleanly may well be the most important aspect of rowing technique.
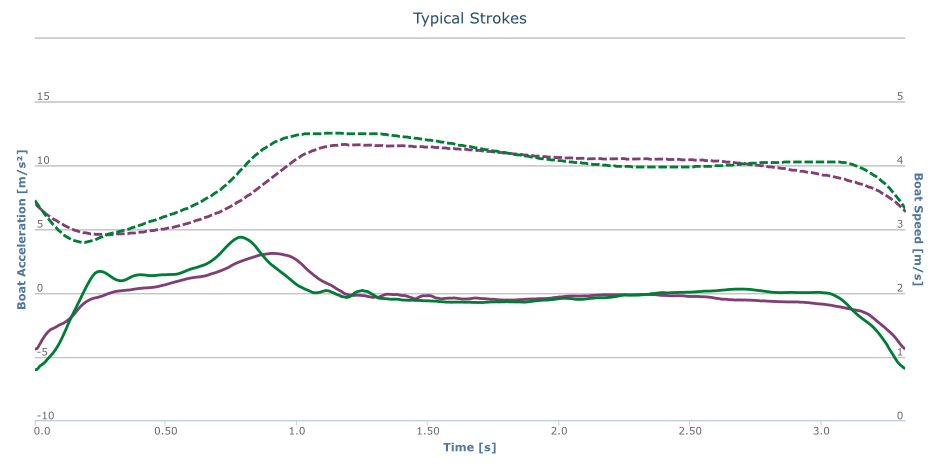
A slow rise of boat acceleration at the catch sets up for a weak drive.
In this example we can see that the purple stroke has a third problem, in addition to a late drive and “standing on the stretcher”. The boat acceleration rises slowly at the catch. Compare this with the strokes above, where we had a weak drive but the slope of the acceleration graph is similar at the catch. In this case however, the slope of the boat acceleration is very weak at the catch as well.
The source for this mistake is usually a “washing in” of the blade. When the blade has not fully entered the water, it cannot generate a positive force on the pin that would propel the boat. It is usually followed by a weak drive. Looking at the speed graph in this scenario however, we can see one interesting aspect though. For a short period at the catch, boat speed is higher for the purple graph. This is a consequence of the catch being “lighter” and because I have manually aligned the speed graphs at the catch so that it is easier to visualize the difference between the speed graphs.
Consider Conditions when Comparing Speed
This is however very dangerous. When we compare speed graphs, Analytics accurately reflects the average speed for the typical stroke speed graph. The speed graph is always centered around the measured the average speed.
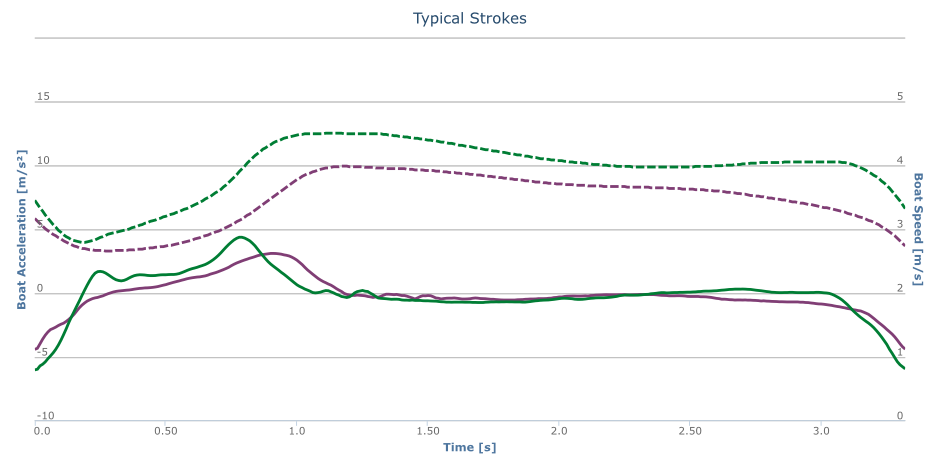
The actual speed graphs before manual alignment
As a consequence, we need to take the measurement conditions into account when comparing the absolute difference between speed graphs. Did you measure rowing up or down the stream? Was there any wind? These two influences directly impact the measured speed, but do not (stream, when it is constant) or only marginally (wind) affect boat acceleration.
There’s one other thing that we should look into when comparing boat speed and that is the variance in boat speed and how it affects the work required to overcome drag. Mechanic work in rowing is a difficult concept, and even more so when we separate it from the physiological load on an athlete which may or may not produce mechanic work… But that’s a topic for another article.
If you have any question about your speed and acceleration graphs, please post them in the comments and I’ll be happy to offer you my view on them.
Want to record and improve your own rowing stroke? Get our App and Try Rowing in Motion.
Interesting discussion thanks!
One thing that this article does show to me is that its very useful to be able to compare and contrast curves from two people/boats to see which might be “better” than the other, which made me wonder if there any plans for Rowing in Motion Analytics to have a few “template” curve perhaps for people to view and compare themselves to? Maybe as “ideal” curves or a few anonymous curves from successful scullers? Or even implement a social sharing aspect where people can share their curves for others to view/comment on?
Thanks for this article. One question: my strokes often have a small kink right at the very tail end of the graph I don’t see here. I suspect it is the blades going into water water but not sure. Example attached.
Hi Mark, that kink has two possible sources. In the 1x it may be a balance issue, i.e. you hit the water with one side first. Another possible reason (especially in crew boats) is an untimely/unsynchronised arrival at the catch.
I’ve also seen this when the sliding seat “hits” the end of the slide.
One sidenote: you should try sampling a larger number of strokes (20+) for reliable, significant results. There’s a lot of (natural!) variability in the rowing stroke and by sampling more strokes you get more significant results (i.e. you don’t compare outliers to outliers).
Interesting, thanks you for your input. I see it in almost every one of my strokes balanced or not – my theory is that it is a touch of backsplash when the blades hit the water. I will have to try out some things and see what causes it.
Thanks for the article. My stroke has a little kink like the one below at the very beginning of the stroke. Any suggestions as to why that may be?
@disqus_KlfIEbbvfi:disqus is it the same as in the graph from Mark below?
Is the pronounced ‘peak’ at the finish in the green plot under ‘A weak catch’ desirable? I sometimes see this in mine and sometimes not.
You mean the peak at around 4.5m/s²? This is not easy to answer. Better have it than not have it I’d say (i.e. there’d be no peak and the graph would stay “flat”), but there’s another dimension to it. You can see that the force production happens quite late into the drive towards the finish. To me this is a hint at a suboptimal approach to the stroke. From a technical perspective, the “front-loaded” drive is better, i.e. with a higher gain in speed early in the drive resulting in a higher average speed and just as important – less variation in speed over the drive. I will write an article on that subject soon.
Sorry, it was the peak in the green acceleration line at about 0.8s I was looking at.
I’ve meanwhile written the article I mentioned – check it out here: http://www.rowinginmotion.com/efficiency-in-rowing/