Typical Stroke Speed Normalisation
We have recently implemented an improvement to the typical stroke calculation algorithm that further improves comparability for typical strokes.
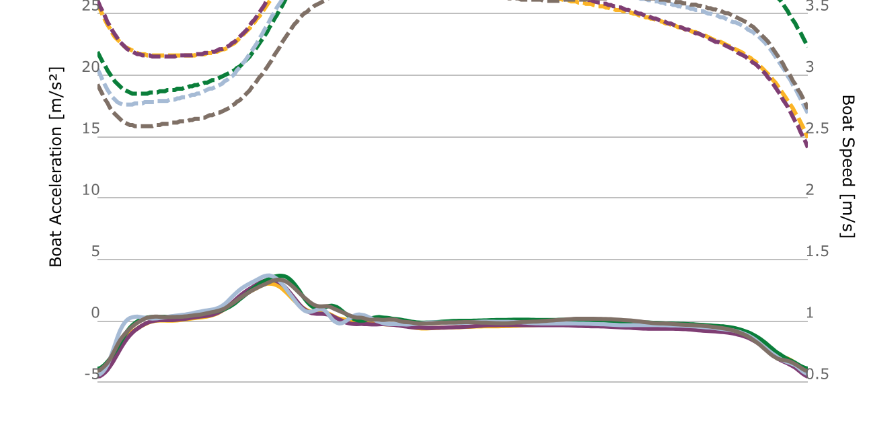
Before the change, typical strokes sometimes exhibited a change in average stroke speed as seen in the chart below.
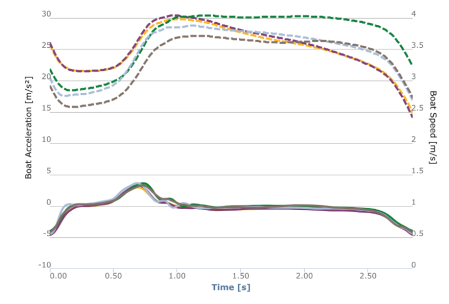
You can see that for some strokes, the boat speed at beginning and end of the stroke do not match. There are three different reasons for why this can happen with our old algorithm:
- Offset calibration error: Even though the App uses an intelligent calibration algorithm and detects and warns the user about offset calibration errors, small offset errors can go through unnoticed. This has by the far the most significant effect on both stroke metrics as well as the typical boat speed graph.
- Boat speed changes: The stroke average boat speed may show a net increase or net decrease for the sample interval selected to calculate the typical stroke profile from. For example, if you select a piece that contains an acceleration of the boat from rest to steady state speed at 20 spm, this net increase in boat speed will most likely have a small effect on the typical boat speed graph because the boat was “typically” accelerating. This tends to only have a marginal effect because strokes with net boat acceleration or deceleration are typically eliminated as outliers before stroke-rate normalization.
- Statistical sampling artifacts: After stroke-rate normalization of all relevant strokes from the selected piece, we use a statistical sampling method to calculate the typical stroke profile. Although the mathematical properties of our method ensure the expetancy value of a net change in boat speed for the typical stroke should be 0, this is not necessary the case because we’re dealing with stochastic data. We found statistical sampling artifacts tend to have only a very small effect (< 0.02m/s).
We did consult with some experienced coaches regarding this and were told they intuitively expect a typical stroke to be a stroke that represents a constant stroke average boat speed. We evaluated various options to fix this and decided the best course of action was to introduce a second normalisation step in the calculation for a typical stroke that will normalise all typical strokes to a net boat-speed change of exactly 0 by applying a bias to each acceleration sample of the typical stroke before proceeding with the typical stroke calculation.
Together with this change, a typical stroke calculation works like this:
- Determine a rounded target strokerate for the selected piece
- Eliminate outlier strokes that are too far away from the target stroke-rate
- Normalize stroke-length of remaining strokes to target stroke-rate
- Apply statistical sampling to derive typical stroke
- Apply speed normalisation
- Calculate stroke metrics and more
The change has already been deployed to Analytics and all calculations of typical strokes going forward will use this new algorith. This also includes saved analyses. In cases where start and end speed of a typical stroke had a large difference as with the yellow and purple stroke in the chart above, this may lead to a significant change in stroke-metrics. Going forward, we expect this change to greatly improve the comparability of typical strokes and make them even more useful to track the progress of your crews as they work on improving their rowing technique.